|
Derek Fountain : ZX Spectrum FFDC
Programmer, Writer, Consultant, Enterprise level ZX Spectrum developer
|


|
|
|
|
|
|
|
|
|
|
|
|
|
|
|||

|
|||

|
|||

|
|||

First Failure Data Capture
My day job is working for IBM in their enterprise storage division. I work on, amongst other things, the SVC storage controller. One of the interesting things about enterprise level software development is the concept of first failure data capture, or FFDC (also know as first time debug and probably lots of other terms).
If an enterprise software system in, say, a bank or airline goes down, it can cost the corporation millions of dollars per hour. Under such circumstances a software developer investigating a problem can hardly say "hmmm, well let's try this and see if it does it again," or "well let's install an instrumented build and see what that tells us next time it happens." No, in enterprise systems the program needs to collect all relevant information the first time the problem happens such that the issue can be diagnosed and debugged without need for recreates or instrumented builds. Hence the term first failure data capture.
The standard solution to this problem is to build trace tables in memory as the program runs. You can think of these as being like a plane's "flight recorder". Large, complex programs build hundreds of these tables, each one collecting and building up a sequence of "checkpoint" data tuples. Some of the tables are in error path code and hence never get filled in until the program goes wrong. Some of them are in the main code structure and get populated each time round an internal loop, the table wrapping occasionally so memory use is controlled. When the software hits a problem it grabs a memory image of all these tables. That image is then sent back to the developers for analysis. By looking at the contents of all the tables it's possible to piece together events, data flows, good paths taken, error paths taken, and other information to build up a picture of what happened in the period before the failure and ultimately see what caused it. As long as the tables contain relevant data, and enough of it, the approach almost always leads to successful debugging.
OK, and the, er, Spectrum link here...?
Z88DK is a C development toolset for, among other systems, the ZX Spectrum micro from the 1980s. I took a liking to Z88DK a year or so back and started to learn how to use it to write Spectrum programs. The Spectrum, in many ways, is like a modern embedded system. It has a feeble CPU and very limited resources. It has 48KB of RAM, which has to be managed very carefully.
In particular, what I learnt once my C programs got bigger than trivial, was debugging Spectrum programs is hard. There's no source level debugger. There's no operating system, let alone operating system support for degugging tools. Even a printf() is complicated and expensive, requiring significant build changes to the program. This all makes debugging a tricky proposition. You can be play testing your new game for several minutes, everything going fine, when suddenly it hits a problem and freezes. What happened? How can you tell? The only real option is to use a Z80 debugger to single step the compiled C code, hoping against hope that you can piece together what it was doing and that something will jump out at you.
Wouldn't it be handy, I thought, if, as your game runs, it builds up a set of sort of flight recorder style data tables which you could capture and analyse, gleaning from them an understanding of what the program was doing, where the sprites were on screen, what buttons the user pressed, what your collision detection routines decided, etc., all in the few seconds before the program asserted or went wrong? That sort of information would allow you to see what happened, what events and stimuli your program accepted, which code paths your program took, leading you towards whatever made it go wrong. What's needed here, I thought, is some first failure data capture, ZX Spectrum style.
For the last few months I've been writing a Spectrum game as an educational exercise, learning more about Z88DK/C, the way it compiles into Z80 assembly language, and how it can be used to build games for the Spectrum. What follows relates to that game. It's all very fluid and most likely will remain so for the foreseeable future. So rather than embed soon-to-be-dead links in this text I've put the most relevant links at the bottom of the page.
Looking at a Spectrum example
Let's dive straight in and have a look at some example trace tables. Put aside for a moment questions of where these came from or how they're being presented. They're from my nascent game. Consider this data tuple:
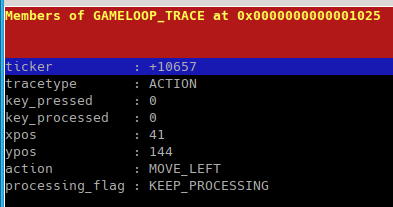
These is from the trace table which builds up in the Spectrum's memory as the game runs around the internal "game loop." The trace is made up of a sequence of these tuples.
Have a look at the data structure. The first value is a ticker, which in this game is a simple 16 bit integer bumped up by an interrupt service routine every 1/50th second. This value isn't currently used in the game, but provides a nice time sync point for the tracing. Ignore the tracetype for now and consider the 2 key processing values. These are TRUE/FALSE flags, the first indicating that a key has been pressed, the second indicating that the keypress has been processed by the game logic. The x,y position values are the screen pixel coordinates of the main sprite in the game, and the action is an enumeration of the action the game loop takes this time round. The processing_flag can be ignored for this example. Now have a look at this table:
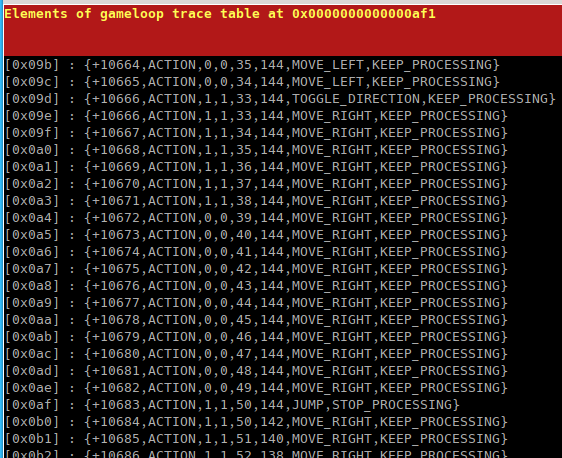
This is a section of the trace table itself, made up from a sequence of the tuples. The gameloop code generates one tuple each time round, so this represents a chronological sequence of what happened as the loop looped.
The first column is the ticker value, which can be seen to be incremementing by one each time round the loop. This game runs at 50 frames per second and there's (normally) one trace tuple per iteration of the loop, so the game loop is in sync with the interrupt service routine. If an iteration took more than one frame (i.e. more than 1/50th sec) it would show with a skipped value in this sequence.
We'll ignore the tracetype column for now, so then we see the key press flag values. At the very top they're both zero, but at ticker value 10666 they both go to 1. That's the point where the user pressed a key, which is what the first 1 means - key pressed. In that tuple we also see the key processed flag go to 1 as well. The way the game is written, the key is supposed to be processed in the same cycle as it's pressed. This provides maximum responsiveness, and is why the press and processed values are (or at least should be) seen as in sync.
The next two columns are the sprite screen position - we'll come back to those in a moment. The next value is an indication of what the game loop logic decided to do this time round. So the top 2 entries we see here show the player as being moved left. (In this game the player moves all the time, this movement isn't in response the keypress.) At point 10666 the response to the key press is to change the player's direction - the action is to TOGGLE_DIRECTION. The next row is also at point 10666 because there were two trace tuples added in that clock cycle, and the second one shows that now the action to be taken is to MOVE_RIGHT. i.e. the player was turned around in response to the key press.
Now look at the x,y values in this sequence. At the top the player's sprite is at 35,144, then moves to 34,144, then to 33,144. The X value is decreasing at the sprite moves left on the screen (0,0 is top left in this game code). The player is at 33,144 at the point they hit the key to switch direction (at 10666), then we see the X value going back up as the player moves right.
It's interesting to note the key flags as the loop iterates. The key was pressed at point 10666 and processed immediately. However we see the key pressed as true up to and including 10671 which is 6 1/50th second cycles. That's 120ms, which as it turns out is fairly typical for a quick tap of a key. (This is why the game needs a key processed flag. In this game, if the key is down for 6 cycles we need to process it once, not 6 times.)
You probably have the idea by now, but let's just cover the next interesting event the trace shows: at point 10682 the sprite has moved right to location 49,144. Next cycle, 10683, a key press is detected and the game logic interprets this as a jump action. You can see at point 10684 the Y coordinate decreasing by 2 as the sprite moves up the screen (the Y coordinate is set up as 0 being top, so lower values make the sprite move "upwards"). That's the jump animation working: the player hits the "jump" key to jump over a hurdle and the sprite starts animating upwards and forwards.
(As I write this article I see something not quite right here. The user hit the jump key at point 10683, which was interpreted as a jump. But at the next cycle the X position value hasn't incremented - it spent 2 cycles at 50. That's wrong, ths design of the game is that the sprite moves one pixel left or right every cycle of the game loop, but it appears that doesn't happen when the user hits the jump key. I need to fix that.)
Here's another trace table tuple from the same data capture:
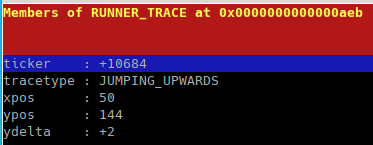
This tuple belongs to a trace table which captures the jumping animation data flow. It contains the ticker value as before, and a tracetype which is an indication as to why the trace point was added to the table. The player's x,y position is as before, and the ydelta value is the value subtracted from the sprite's Y coordinate this cycle in order to progress the jumping animation.
Here's the table that tuple comes from. This one isn't collected evey game loop cycle, that would be unnecessary. This table is populated while the jump animation is playing. (The table happened to wrap at this interesting point so it's in 2 screen grabs, but don't worry about that):

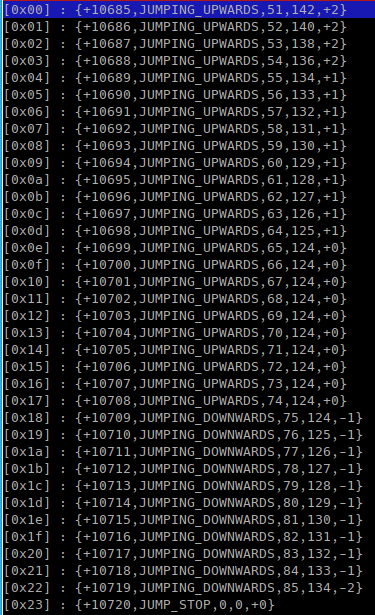
The ticker is the left column as before. Recall from the game loop that the user pressed the key and the jump started at ticker point 10683. This table shows that the jump animation started at exactly that point, which is correct.
As we look further down the table we see the X coordinate incrementing one pixel per cycle, which is correct as the player was moving right (reference point 10684 onwards in the game loop screen grab above). The Y coordinate delta increments by 2 for several cycles, then by 1 for several more, which plots the rising part of the arc the jump animation follows. It then goes through a flat bit at the top of the arc, then the Y-delta goes negative as he starts falling, which is the downward side of the arc. This trace shows the jump animation progress, and it's working fine.
You might notice that the rising side of the jump animation goes up 2 pixels at a time for the first 5 cycles, but the falling side goes down 2 pixels (point 10719) and then the animation stops (point 10720). Why would that be? The answer comes from a third trace table, the one which traces the game's collision detection:

This trace table shows that at point 10719 the player was facing right and falling with no problem. Next cycle he's gone down 2 pixels and the collision detection has detected that he's landed on a surface, which is why at point 10720 the jump animation suddenly stops.
Hopefully you get the idea. Given this sort of trace information it's possible to see what the program did and why it did it, which for a system where there's no real debug support can be priceless. As I write this the game these traces come from is still in the initial stages and is very much a work in progress. However I did hit a bug in it which the tracing helped me pin down. I commented and kept the bug report, so if you're interested in a worked example of debugging it's here.
The code
Building these tuples in a program is just matter of programming. Working in C, the example "game loop" trace tuple at the top of this page looks something like this:
typedef struct _gameloop_trace
{
  uint16_t           ticker;
  GAMELOOP_TRACETYPE tracetype;
  uint8_t            key_pressed;
  uint8_t            key_processed;
  uint8_t            xpos;
  uint8_t            ypos;
  GAME_ACTION        action;
  PROCESSING_FLAG    processing_flag;
} GAMELOOP_TRACE;
By convention I create my types with capitalised names; the non-standard 3 types you see in that structure are 8-bit enums defined elsewhere.
The trace table itself is therefore simply an array of these, so in C it would logically be something like:
GAMELOOP_TRACE gameloop_tracetable[200];
with a bit of code to handle inserting of tuples and wrapping the table when it has filled 200 entries.
Typically you'd create several such tables containing different structures to trace different parts of the game code. Part of the art is deciding what trace data to store and how many tuples you need in order to be able to piece together what the program did. It's all a memory compromise. The game loop structure shown above takes 2 bytes for the ticker, plus one byte each for the other values, giving 9 bytes per tuple. 200 of those is 1800 bytes. A 50fps game which generates one tuple per game loop would fill such a trace table in 4 seconds. Is 4 seconds of history enough to work out what happened when something went wrong? It depends on the game, the program structure and probably a few other things.
My game's jumping animation trace table discussed above is 2 bytes for the ticker, one byte for the trace type, one each for X and Y coordinates and one more for the y-delta: 6 bytes, and the table is only 50 entries because it only really needs to store the progress of a single jump animation. That table's 300 bytes, and it's frequently possible to trade a bit of memory for more CPU cycles if necessary. (For example, the game loop trace stores the key-pressed and key-processed values in one byte each, while they only really need one bit each.)
The memory consumption
All of which leads us to the downside of this approach: memory consumption. With only 48K of RAM to start with, the humble Spectrum isn't exactly well equipped to support too many of these sorts of trace tables. However, there's trick which helps here: store them in the ROM.
Clearly, storing data in the ROM isn't an option in a real Spectrum, but some emulators support making ROM writable, and most developers would work on an emulator for most of their development cycle. In a development environment where this debugging technique is going to be used, storing data in ROM is acceptable. Fuse, for example, allows this via the Options->General->Allow writes to ROM option, which provides a very handy 16K of extra space in which to store things.
Next question, then, is how you store an array of structures in the memory area normally considered ROM? It's possible to persuade the C compiler to do this using a C array defined externally in an assembly snippet, but resizing the tables proved tedious and error prone. In practise it worked out more flexible and hence easier to do it with pointers instead.
Capturing the tracing image
Once your program has been running a while and trace tables have built up, you'll need to capture them so they can be examined and analysed. This is simple enough provided your emulator has a "save memory" feature. On Fuse this is under File->Save binary data.... Provide a range of 0 to 65535 inclusive to dump the whole 64K of memory. If you only want the traces, and they're all in ROM space, 0-16383 will do, but it's frequently useful to be able to go into the game's normal RAM memory space to see the runtime structures there.
Also worth noting is the feature of RZX captures which allows for embedding a snapshot inside the RZX. Fuse does this by default every 5 seconds, and it's very useful for intermittent problems. You start recording the RZX, run your test, and when you hit the problem you unpack the previous snapshot from the RZX recording, take a memory dump from it, then check the traces to see if anything has gone arwy at that point. If all is OK at that point you can continue the playback, stopping the emulator at the failure point. This way you only need a maximum of 5 second's worth of tracing. RZX files, with or without snaps, essentially give you the ability to capture your traces at any point, and they're very useful.
Analysing the traces
So, we've looked at how Spectrum C programs can create runtime traces in memory, and how those traces can be extracted into a file ready for analysis on a PC. This leaves the question of how this analysis is done. We've actually already seen the answer - those white-on-black screengrabs above - but first we must introduce the tool, BE.
Many, many years ago I worked with a chap named Andy Key. Andy moved on from where we worked a long time ago, but he left a legacy: his binary editor program, called BE.
Imagine you have a blob of binary data. It could be a Spectrum memory image as we're discussing here, it could be an image file like a JPEG or PNG, it could be a Word file, it could be anything. The point is that it's a binary blob which you know contains structured data. It might not reveal a great deal when looked at with a hexdump tool, but imagine you had a tool where you could specify via a configuration file how the data in that file is structured. "There's a 16 bit integer at this offset, followed by 2 8 bit signed values, followed by a 200 entry array of this structure... At this offset there's a structure like this, then there's a character string of 256 bytes..." And so on. Now, open the binary file in the tool with the appropriate data structure descriptor file and it can pick out all the binary values, strings, structures and whatever, and present them to you in an ordered manner. That is essentially the tool which Andy wrote: BE, and it's public domain.
BE can unravel any sort of binary data structure if you give it an appropriate descriptor file, but it's really competent when it comes to examining programmatic data structures. It understands things like signed and unsigned data values, big and little endian, zero terminated ASCII strings, enumerations, etc. It handles C structures and unions, including ones which contain embedded structures and unions. It handles arrays and linked lists, and can do tricks like internally convert a linked list into an array making presentation of such data much easier to look at.
Recall this screen grab, which shows BE displaying an entry from a trace table I collected:
Here's the C code declaring the relevant data structure:
typedef struct _gameloop_trace
{
  uint16_t           ticker;
  GAMELOOP_TRACETYPE tracetype;
  uint8_t            key_pressed;
  uint8_t            key_processed;
  uint8_t            xpos;
  uint8_t            ypos;
  GAME_ACTION        action;
  PROCESSING_FLAG    processing_flag;
} GAMELOOP_TRACE;
In order to get BE to display that data structure you need to describe it to BE in the configuration file. That's done like this:
def GAMELOOP_TRACE struct
{
  n16 dec unsigned                "ticker"
  n8  map GAMELOOP_TRACETYPE open "tracetype"
  n8  dec unsigned                "key_pressed"
  n8  dec unsigned                "key_processed"
  n8  dec unsigned                "xpos"
  n8  dec unsigned                "ypos"
  n8  map GAME_ACTION open        "action"
  n8  map PROCESSING_FLAG open    "processing_flag"
}
This description is detailing the members of the structure: the top one is a 16 bit number, the rest are 8 bit numbers. Most are presented as "dec"imal values, others are mapped onto enumerations (definitions not shown here). All fields get a text label. This is a simple example. In big, real world applications BE description files can be enormous - many megabytes of descriptors describing gigabytes of binary data structures from server side memory images. The Spectrum isn't quite at that scale but the principle applies.
You might wonder why the conversion from C to the BE structure format is necessary. The answer is that BE doesn't just show structure in C derived code, it can show structure in any binary data, so it has a generic data description grammar of its own. I'm working on a translation tool which will scan C source code and generate BE definitions from it; it's a work in progress. although complete enough to handle the structures in my little game. I added the structures from the Z88DK SP1 sprite library, but I had to do those by hand. Fortunately they don't change from one year to the next. :)
Exploring the tracing structures with BE is starting to get beyond the scope of this article. I captured a short desktop video showing some navigation around some trace structures to give you an idea:
Using tracing and BE to debug Spectrum programs is something which I'm only just getting started with. There's a quite a bit of work involved in the process, and this article is only an introduction to the idea and the tools. I've got plenty of work to do on the specifics, but my experience in industry and the work I've outlined here so far convince me that the approach is a sound one.
Relevant links
The very-much-work-in-progress game I reference in this article is here. The BE-for-the-Spectrum related code is in a separate Github project here. The game uses the BE project as a submodule so you'll get everything you need as a worked example if you clone the game project with:
git clone --recurse-submodules https://github.com/derekfountain/zxwonkyonekey.git
Site and content Copyright 2023 Derek Fountain - All Rights Reserved